Service: Dataviz/Information Design
Hire me to make datavisualizations!
Visual communication is widespread nowadays, because it is one of the most efficient ways to catch people’s attention and share information with them. Indeed, research has shown that not only is vision the most dominant human sense, but adding a visual component in communication improves processing, understanding and even memorization of information.
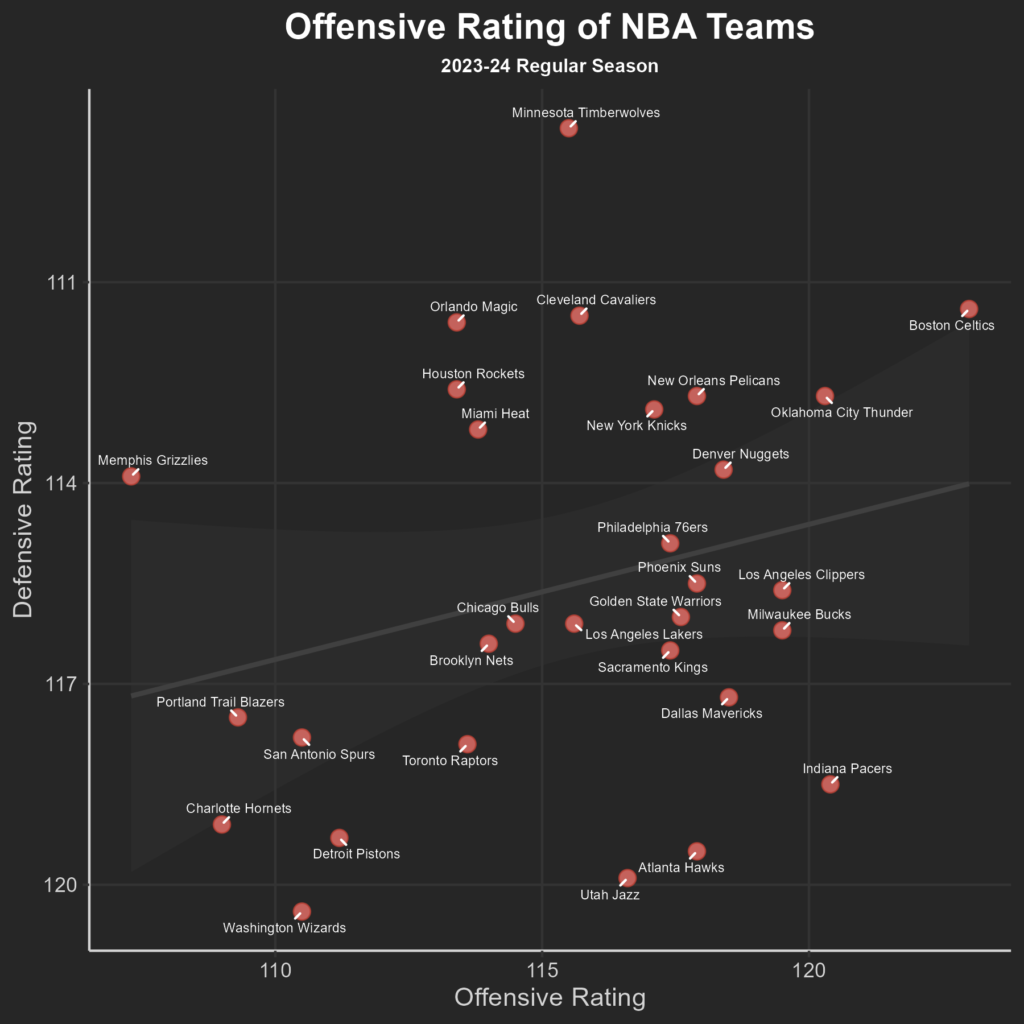
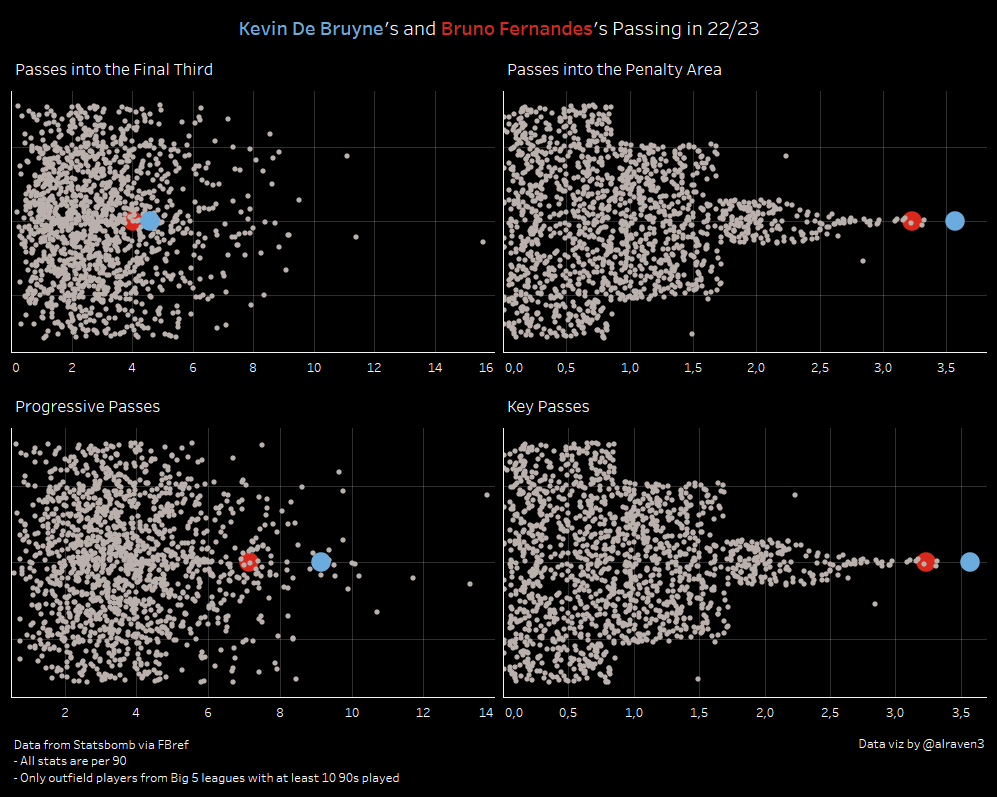
My speciality is datavisualization, which consists of displaying graphically data or other types of information that you wish to highlight. I can create visualizations according to your own requirements, and whether you want me to take charge of the whole process on my own, from data exploration to visualization, or to help you with more specific tasks!
As each project is unique, we’ll work together to determine your needs, requirements and project specifications. This first stage enables me to make a detailed assessment of the complexity of the work required and the resources needed. On this basis, I will draw up a quotation specifying the estimated costs of the service.
I am proficient with many different tools, formats and types of datasets. Here are the four main kinds of datavisualizations that I can produce for you:
Charts.
Dashboards, namely grids with multiple variables and/or charts.
Infographics, i.e. graphical compositions that include a mix of visualizations, images and text.
Interactive visualizations, which allow the user to explore the data on their own.
Consulting
If you already have an ongoing project involving data visualisation, I’m also available as a consultant to supervise or advise on improving the quality of your visual communication.
Workshops & Tutorials
If you’re looking to integrate or develop datavisualisation within your organisation, I can give introductory workshops or tutorials on specific tools or aspects of datavisualisation.


